Since my beginnings in the realm of wireless communications, I have had an interest in the 900MHz part of the ISM bands. This small group of frequencies left unlicensed to the general public is nestled right in between some crowded licensed bands. It is dedicated to variety of uses including amateur radio, Radio-Frequency Identification (RFID) and the now obsolete cordless home telephones.
The first project I worked on using 900MHz was actually a dedicated point to point data link. It was about a mile and a half shot through a mix of trees and older urban areas. Using full one-meter parabolic dish antennas, we were able to achieve a consistent data throughput of about seven to eight Mbps. Back in 2007, this was quite a feat! However, we were fighting constant and terrible interference. The only tools we had in our toolbox at the time to see what was going on in that airspace were the radios themselves. They had a built-in command line utility that would give you a quick snapshot of what were essentially channel utilization numbers. That was all you got. It was difficult and time consuming, yet we made it work and in the end the client was happy.
Since then, I hadn’t had much in the way of opportunities to work with 900MHz. That was until I came to work for GPA and transitioned into industrial and manufacturing Operational Technology (OT). Now I get the occasional chance to play with 900MHz gear, mainly for sensor and remote IO networks. That first adventure into the sub gigahertz band years ago made me realize I needed to find a dedicated spectrum analysis tool for this frequency range. I didn’t ever want to get stuck like that again.
Several years ago, I invested in the Metageek spectrum analyzer software, Chanalyzer. I read that it had 900MHz analyzing capabilities, I just needed the proper adapter for it. Unfortunately for me, that adapter had been discontinued for a number of years. After a year and a half of searching, I found one on eBay and snatched it up. Finally, I had the tools I had been wanting for years.

Not long after acquiring the adapter, a local wastewater treatment facility asked our team to come out and take a look at their facilities. They wanted to expand their current wireless IO deployment. I took this opportunity to get my first 900MHz spectrum recordings using Chanalyzer.
Once I was on site, I fired up Chanalyzer, connected my new (well, new to me anyway) WI-SPY900x device, hit record and got the following captures.
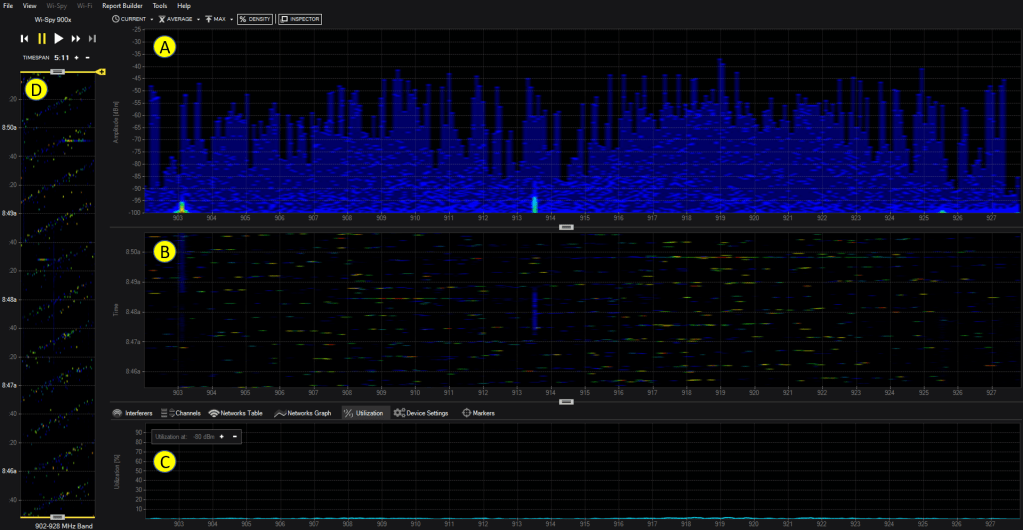
For those not familiar with Chanalyzer, here is how its display breaks down. Area A is the Density View which shows what is currently going on in the spectrum. You can identify devices, see how loud they are and how often they are transmitting. The height shows the signals amplitude and the color shows utilization. From the Chanalyzer documentation:
“A blue spike or shape indicates a short signal, like a clap. A red spike or shape indicates a long, continuous signal, like an air horn.”
- Blue – Less than 10 percent utilization
- Green – 20 percent utilization
- Yellow – 40 percent utilization
- Red – Over 50 percent utilization
Area B is the traditional Waterfall Graph. It shows amplitude over time for all frequencies in the selected band. The color here though represents signal amplitude, not duration. Blue represents low amplitude and red indicates high amplitude.
Area C measures utilization thresholds and expresses it as a percentage of airtime usage. The higher the usage percentage, the less time there is available for a new access point to communicate.
Area D is one of the main reasons of why I like Chanalyzer over other spectrum analysis tools. It takes the waterfall graph and elongates it over time, stretching it if you will. What this does is allow you to see patterns and distributions over time that can be difficult to see on a standard waterfall display.
The radios being tested that day were the Banner DX80DR9M-H and -H2 models. They are 900MHz multi-hop auto-meshing/self-healing wireless network devices. These compact little radios can push up to one full watt to an external antenna. The -H model is industrial/hazardous location rated.

While not operating on the 802.11 or 802.15.4 standards, they do use Frequency Hopping Spread Spectrum (FHSS) transmission methods. This helps to avoid interference (especially narrowband interference) and makes it difficult to jam or otherwise intentionally disrupt communication between hops.
Before testing began, I recorded a sample of what was currently going on in the local airspace at the central radio aggregation point. The client already had some older Banner radios bringing back Modbus based sensor readings from several remote points, and I wanted to see if there was any heavy traffic across the spectrum. What I got was an incredible capture of activity in the 900MHz ISM band. In both the standard and stretched waterfall graphs traffic patterns are clearly visible and easy to identify.
Moving out to the remote locations, we set up for testing. Link testing was very simple as the radios were placed into a testing mode which then transmitted a predetermined number of frames back and forth to calculate the quality of the link from radio to radio. In the following image, looking at the left pane you can see where the initial connection happens and then the heavier traffic as the actual link quality test begins.
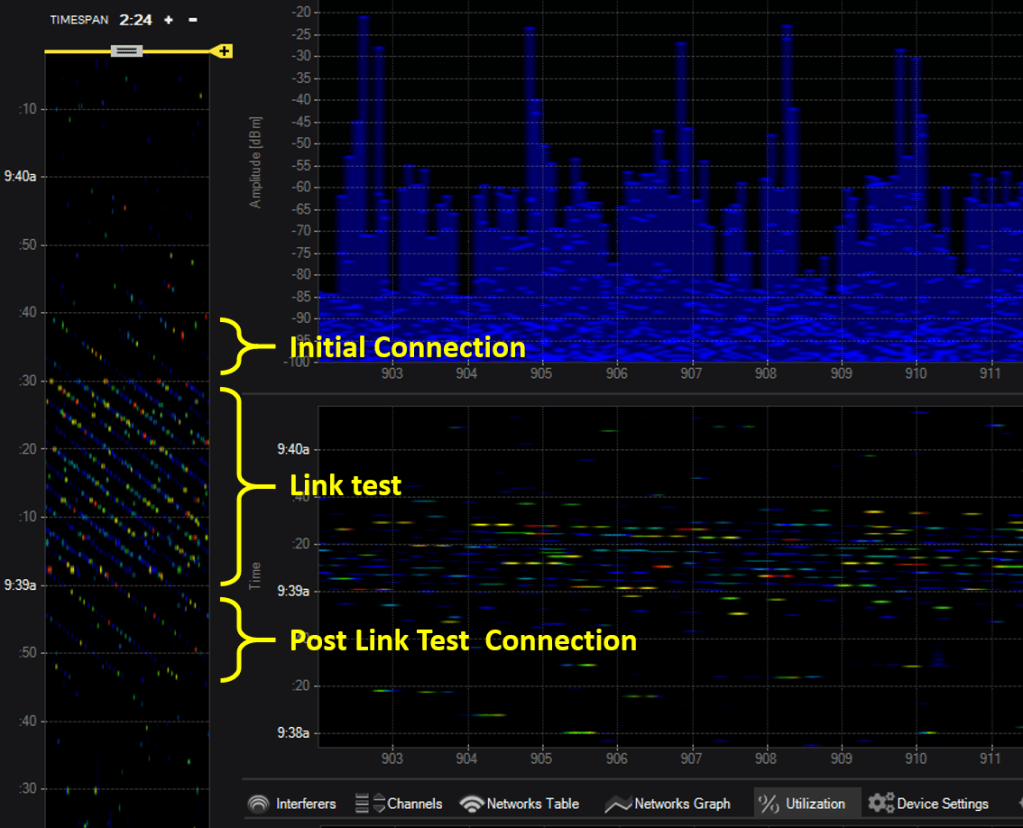
What’s great about this is that you can see Frequency Hopping in action throughout the entire test, from the initial connection all the way through to the post test link. When looking at the traditional waterfall graph, it is fairly hard to discern the FHSS patterns unless you look closely and study the imaging. If you know that you are specifically looking for an FHSS pattern, then it is easier to spot.
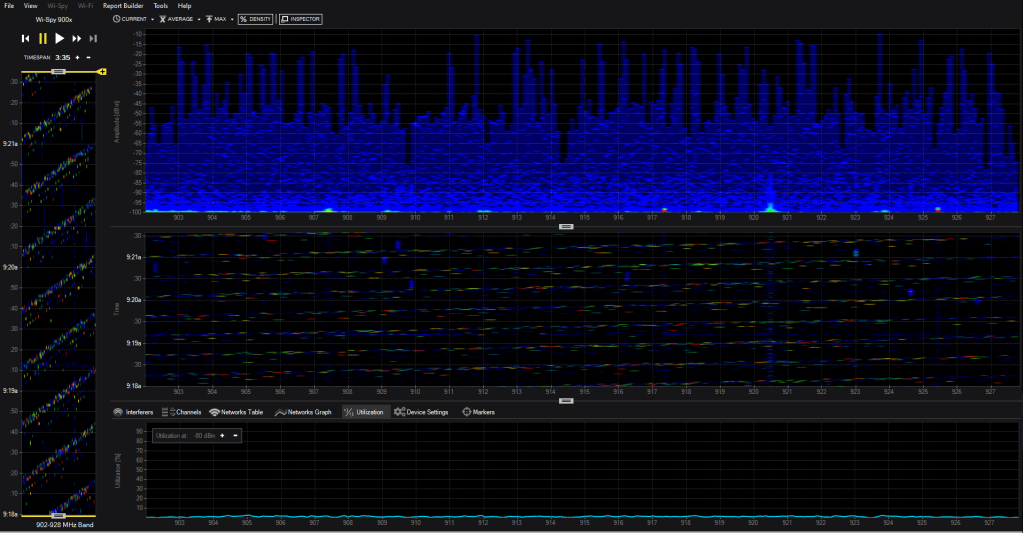
At the second remote location an extended link test shows more of the now familiar FHSS transmission patterns. However, this time it is a little easier to make out in the traditional waterfall graph.

What is nice is finally being able to see both the structured traffic and the unstructured “noise” in the sub gigahertz ISM band. Having this visibility has given me new insight for wireless IoT, IIoT and other sensor networks. Its penetration values and range capabilities more than make up for its lack of high data rates, especially when it comes to low bandwidth requirements for a deployment. As a useful frequency range, 900MHz is going to be around for a long time.
If you have enjoyed what you have read, follow this blog as I share my experiences, blunders, how-to’s, tips, and opinions in all things OT Wireless from the wonderful world of industrial WiFi!

Great blog I enjoyed rreading
LikeLike